
Figure 5. preBötC neurons in primary culture.
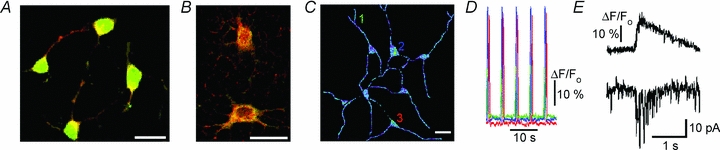
A, staining for 5-HT-4a receptors (green) and MAP2 (red). B, staining for NK-1 (green) and μ-opioid receptors (red). C, cluster of active respiratory neurons. D, calcium changes. Multicoloured traces correspond to ROIs indicated in C. A sample trial is presented in Supplementary Movie 3. E, calcium transients in the cell soma and membrane current measured at the holding potential −40 mV. Scale bars in all panels, 20 μm.