
Figure 1. Developmental changes in IpCa inactivation at the calyx of Held.
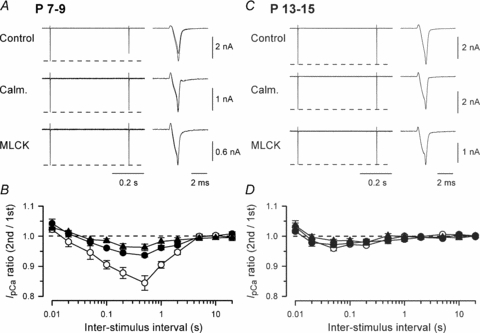
IpCa was induced by paired depolarizing command pulses (from −80 mV to 0 mV, 1 ms in duration) in P7–9 (A and B) or P13–15 (C and D) rat calyces. A and C, sample records of IpCa after application of calmidazolium (Calm. 20 μm by preincubation), or MLCK peptide (MLCK, 30 μm, by intraterminal application), or without application of CaM inhibitors (Control). The fist and second IpCa are superimposed on the right panel at faster time scales. Dashed lines indicate the first IpCa amplitudes. B and D, the ratio of the second IpCa amplitude relative to the first one (IpCa ratio on ordinate) at different ISIs (abscissa) after calmidazolium treatment (•), intraterminal application of MLCK peptide (▴) or with no inhibitor application (○). At P7–9 (B), maximal IpCa inactivation (at 0.5 s ISI) was 15.6 ± 2.4% (n = 6) in control, 6.4 ± 0.6% (n = 5) after calmidazolium treatment, and 3.7 ± 1.1% (n = 5) after intraterminal MLCK peptide application. At P13–15 (D), maximal IpCa inactivation (at 50 ms ISI) was 4.1 ± 0.7% (n = 7) in control, 2.8 ± 1.0% (n = 4) after calmidazolium treatment, and 1.5 ± 0.5% (n = 5) after intraterminal MLCK peptide application. Results were essentially the same when the charge instead of amplitude was measured for IpCa. In this and following figures, data points and bars indicate mean and s.e.m.