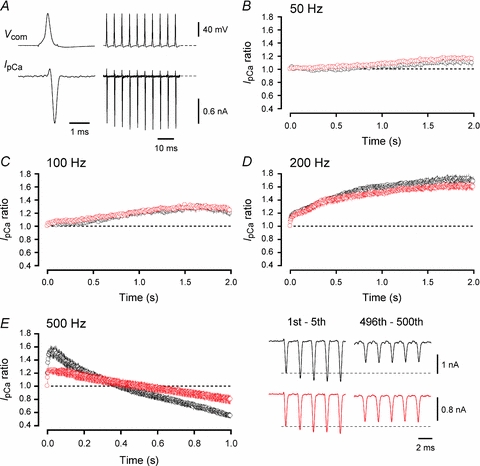
Figure 6. Involvement of CaM in activity-dependent inactivation and facilitation of IpCa at P13–15 calyces.

A, sample records of IpCa evoked by 200 Hz trains of AP-waveform command pulses (Vcom). The AP-waveforms were obtained from another calyceal terminal at the resting potential of −71 mV. The initial AP (shown on a fast time scale) had an overshoot of 22 mV. B–E, the IpCa amplitude, normalized to the first one, during 50 Hz (B), 100 Hz (C), 200 Hz (D) and 500 Hz (E) trains, in the presence (red) and absence (black) of MLCK peptide (30 μm) in the calyceal terminal. Averaged data are from 4 to 5 calyceal terminals. Sample records in E show the 1st–5th and 496th–500th IpCa during 500 Hz trains, in the absence (black traces) and presence (red traces) of MLCK peptide. The maximal IpCa facilitation and inactivation was 55.2 ± 5.3% and 45.9 ± 4.9%, respectively, in control (n = 5), and 27 ± 4.2% (P < 0.03) and 21.3 ± 6.2% (P < 0.02), respectively, in the presence of MLCK peptide (n = 4).
