
Figure 3.
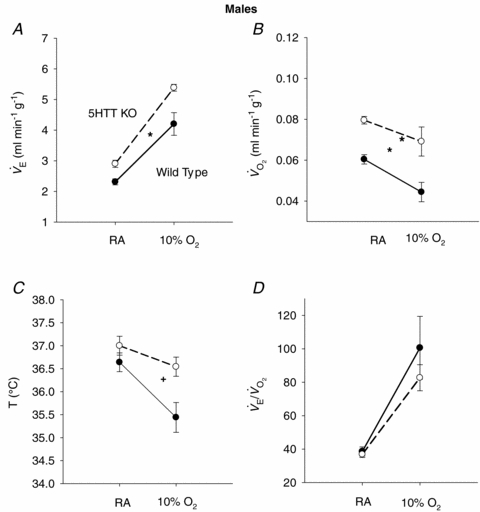
The responses of  (A),
(A),  (B), body temperature (C), and
  (D) in unanaesthetized, unrestrained male wild-type (•; n = 5) and 5-HTT knockout mice (○; n = 7) are shown while breathing room air (RA) or 10% O2 in nitrogen during wakefulness. The symbols show the mean values and error bars show s.e.m.*P < 0.001; +P < 0.05, for main treatment and interactive effect.