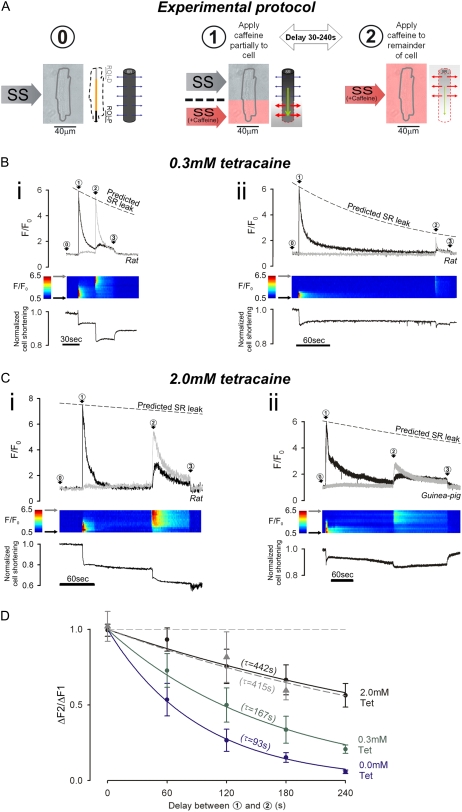
FIGURE 4.
Measuring SR Ca2+-mobility. Caffeine is used to estimate the decline of distal [Ca2+]SRT, while Ca2+ is being drained from the proximal end of SR. (A) Dual-microperfusion apparatus is used to deliver two solutions: SS (without Tet or with 0.3 or 2 mM Tet) and SS + caffeine (10 mM with no Tet). Myocyte is first bathed in SS + Tet (configuration 0). Throughout the experiment, intracellular Fluo-3 fluorescence (F/F0) is averaged in two ROIs, each 20% of cell length, one positioned proximally (ROI-P) and one distally (ROI-D), at the ends of a line scan (see schematic diagram shown to the right of configuration 0). SS + caffeine is then applied to proximal end of myocyte to start SR-drainage (configuration 1); after a 30–240 s delay, SS + caffeine is applied to whole cell (configuration 2) to assess remaining SR Ca2+-content. At the end of the experiment, cells are returned to 0Na0Ca, free of CPA, Tet, and caffeine (not illustrated, denoted by arrow 3 in B and C). (B) SS microstream (but not SS + caffeine microstream) contained 0.3 mM Tet. (i) Rat myocyte; delay of 30 s between configurations 1 and 2. (Upper panel) F/F0-time course for [Ca2+]i averaged in ROI-P (black trace) and ROI-D (gray trace). Dashed line shows predicted decline of caffeine-mobilizable Ca2+-release because of SR Ca2+-leak (from Fig. 3). (Middle panel) Longitudinal F/F0 line scan (y axis normalized to cell length). (Lower panel) cell shortening. (ii) Rat myocyte; delay of 240 s between configurations 1 and 2. (C) SS microstream (but not SS + caffeine microstream) contained 2.0 mM Tet. (i) Rat myocyte; delay of 120 s between configurations 1 and 2. (ii) Guinea pig myocyte; delay of 180 s between configurations 1 and 2. (D) Ratio of distal fluorescence rise (configuration 2) to initial proximal rise (configuration 1), ΔF2/ΔF1, for different delay times. Rat myocytes with 2 mM Tet (black), 0.3 mM Tet (green), and zero Tet (blue). Guinea pig myocytes with 2 mM Tet (gray) (4–12 cells/data point). Time constants (τ) obtained from monoexponential fits.

