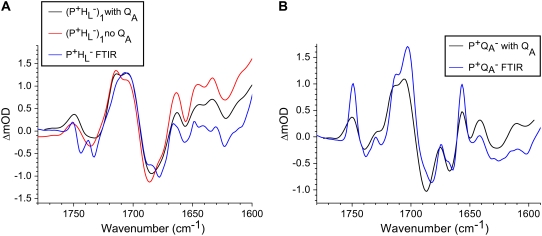
FIGURE 10.
Comparison of fs mid-IR spectra and FTIR spectra of radical pair states. (A) Comparison of EADS of the  state measured for the samples with (black) and without quinone QA (red) excited with 600 nm light and summed FTIR spectra of P+ (39,47–49) and
  (blue) (43,44) (note that the FTIR spectra were not normalized). (B) Comparison of the EADS of the
  state (black line) formed after 600 nm excitation and summed FTIR spectra of P+ (39,47–49) and
  (blue line) (39–41,45,47–49).

