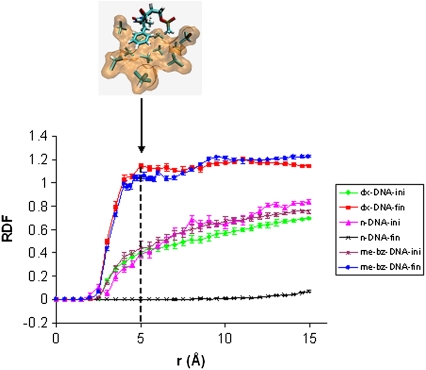
FIGURE 6.
RDF calculated for n-DNA, me-bz-DNA, and DX-DNA from the initial and last 250 ps of the simulation; “ini” means the average over the initial 250 ps of simulation, whereas “fin” means the average over the final 250 ps of simulation. The peak at 5.0 Å is the first solvation shell of chloroform shown in orange surface; the methyl and benzyl groups are shown as a stick representation in element color. The method used for the sampling error bar is from Flyvberg and Pertersen (31).

