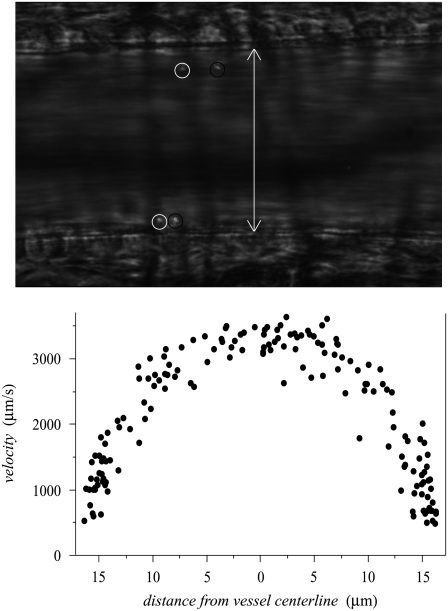
FIGURE 1.
Typical bright-field image (top) showing dual images of two microspheres (∼0.5-μm diameter) in a 46-μm-diameter mouse cremaster muscle arteriole in vivo. The dual images of each microsphere (encircled in white upstream and black downstream) are separated in time by the double flash interval, which was 9 ms for this data set. The white arrow indicates the anatomical diameter of the microvessel. Shown in the bottom panel is an unfiltered μ-PIV data set from a 34-μm-diameter arteriole. Note the axisymmetric distribution of the data. These data were folded onto one-half of the vessel diameter and monotonically filtered. This filtered subset of the data was then used in the nonlinear regression analysis to find the velocity profile, which can be seen, together with the monotonically filtered data, in row C of Fig. 5.

