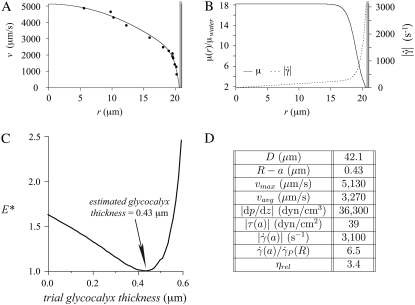
FIGURE 2.
Results from a 42.1-μm-diameter arteriole under control conditions in the mouse cremaster muscle. Shown in panel A are intravital fluorescent μ-PIV data (symbols) collected at the same time point in the cardiac cycle, and the corresponding predicted axisymmetric velocity profile extracted from the data (curve). Blood viscosity (solid curve) and shear-rate (dashed curve) profiles are shown in panel B. The shaded region near the vessel wall represents the endothelial glycocalyx. Shown in panel C is the variation, relative to trial glycocalyx thicknesses, in the normalized least-squares error, E*, associated with the fit to the μ-PIV data shown in A. The estimated hydrodynamically effective thickness of the glycocalyx corresponds to the value of R – a associated with the local minimum in this curve, which occurs at 0.43 μm in this case. Tabulated in panel D are the measured vessel diameter, D, the estimated glycocalyx thickness, R – a (where R = D/2 is the vessel radius and a is the radial position of the blood–glycocalyx interface), the maximum, vmax, and average vavg, velocities of the predicted axisymmetric velocity profile, the magnitude of the predicted axial pressure gradient, |dp/dz|, the magnitude of the predicted shear stress, |τ(a)|, and the magnitude of the shear rate,  at the blood–glycocalyx interface, the ratio of the predicted interfacial shear rate,
  to the wall shear rate,
  of a Poiseuille flow having a centerline velocity equal to vmax, and the predicted relative apparent viscosity, ηrel.

