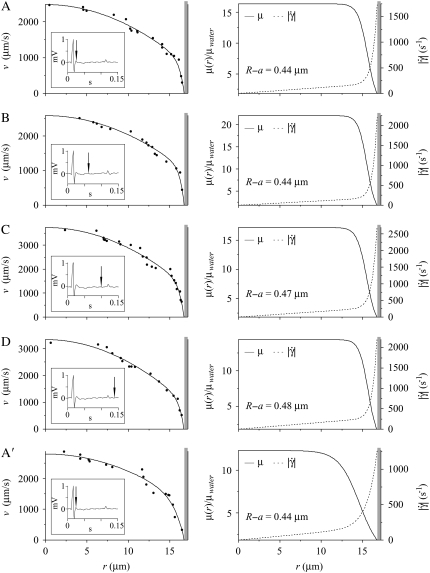
FIGURE 5.
Results from a 34.4-μm-diameter arteriole under control conditions in the mouse cremaster muscle at four time points in the cardiac cycle. Shown in the left column are intravital fluorescent μ-PIV data (symbols) and the corresponding predicted axisymmetric velocity profiles (curves) extracted from the data. The inset shows the time point in the cardiac cycle where the data were collected (vertical arrow). Data sets A and A′ were collected 0.01 s after peak systole. Data sets B, C, and D, were respectively collected at 0.048, 0.085, and 0.123 s after peak systole. The five data sets were collected over a period of ∼15 min, with set A being collected first and set A′ being collected last. Over this period, the heart rate of the mouse was ∼400 BPM. Shown in the right column are the corresponding predicted blood viscosity profiles over the arteriolar cross section. Shown in the right column are the corresponding predicted blood-viscosity (solid curve) and shear-rate (dashed curve) distributions over the arteriolar cross section. The shaded region near the vessel wall represents the endothelial glycocalyx. The estimated glycocalyx thickness, R – a, is displayed for each of the five data sets. Notice that throughout the cardiac cycle there is little change in the thickness of the glycocalyx. Also note that the maximum observed centerline velocity occurs in data set C, and is ∼50% greater than the centerline velocity observed in data set A.

