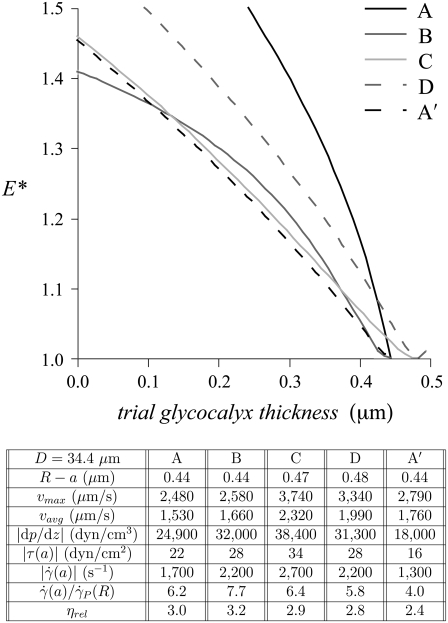
FIGURE 6.
The variation, relative to trial glycocalyx thicknesses, in the normalized least-squares error, E*, associated with the fit to the μ-PIV data for each of the five data sets shown in Fig. 5. Tabulated below is the diameter, D = 2R, of the arteriole and the estimated glycocalyx thickness, R – a, associated with each data set, as well as the corresponding values of the same hemodynamic parameters shown in Figs. 2 and 3.

