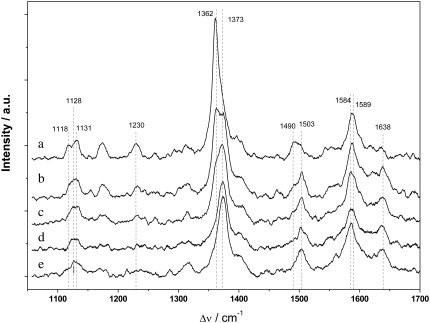
FIGURE 12.
SERR spectra of cyt cred adsorbed on a DTP-modified roughened Ag electrode immersed in buffer solution measured at different potentials. Spectra taken at (a) 40 mV, (b) 90 mV, (c) 140 mV, (d) 240 mV, and (e) 350 mV. More positive potentials cannot be applied because of irreversible damage to the Ag electrode.

