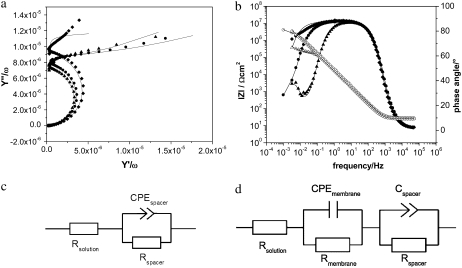
FIGURE 3.
Impedance spectra, frequency normalized admittance (a), and Bode plots (b) of the Ni-NTA modified surface before (♦) and after binding of CcO before (•) and after in situ dialysis to form the lipid bilayer around the protein (▴). Dotted lines represent experimental data. Solid lines show the fitted curves using the equivalent circuits (d) except for the Ni-NTA modified surface where circuit (c) was used.

