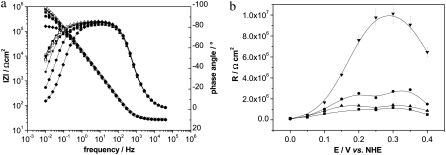
FIGURE 5.
(a) A series of impedance spectra of CcO embedded in a ptBLM recorded at different bias potentials versus NHE at a fixed concentration of 1.8 × 10⁻⁴ M cyt c, black: +400 mV, red: +350 mV, green: +300 mV, yellow: +250 mV, pink: +200 mV, orange: +150 mV, cyan: +100 mV, magenta: +50 mV, violet: 0 mV. (b) Such spectra were recorded for various concentrations of cyt c. Resistivities for the different concentrations plotted versus potentials, (▾) 0 M, (•) 1.07 × 10⁻⁴ M, (▴) 1.82 × 10⁻⁴ M, (▪) 5.07 × 10⁻⁴ M.

