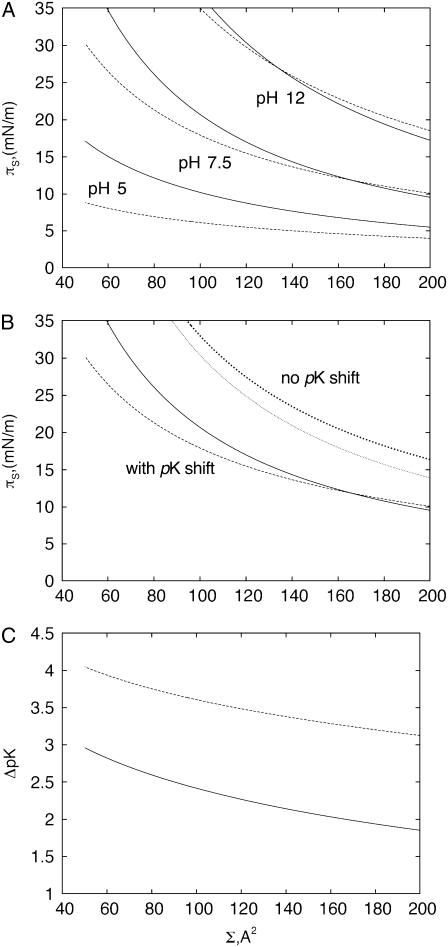
FIGURE 2.
(A) Calculated isotherms of electrostatic surface pressure at low (c = 10 mM; dashed line) and high (c = 250 mM ; solid line) subphase ionic strength at pH = 5,7.5,12. (B) Isotherms of electrostatic pressure with and without accounting for the dependence of effective pK values on the potential of the monolayer. Values: c = 10 mM (dashed line) and c = 250 mM (solid line) accounting for pK shift, c = 10 mM (large dots) and c = 250 mM (small dots) without accounting for pK shift. (C) Variation in pK values (pKe − pK) as a function of surface area per lipid molecule (Σ) at pH = 7.5 and c = 10 mM (dashed line) or c = 250 mM (solid line).

