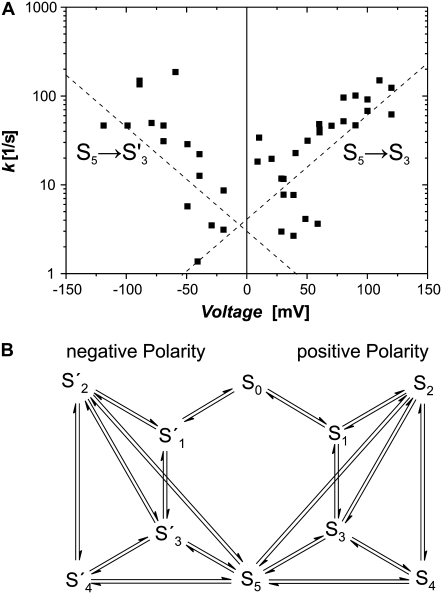
FIGURE 5.
Voltage-dependent rates of TOM core complex channels. (A) Voltage dependence of the transition rate between conductance states S5 → S3. Due to the logarithmic scaling of the ordinate, voltage-dependent rates are represented as linearly correlated clusters of data points. Note the bimodal V-shaped relation that indicates that transitions from conductance states S5 to S3 are governed by two almost symmetric processes with rates  and
and  In this particular case both rates were voltage-dependent with
  = 21 ± 9 s−1 and
  = 0.013 ± 0.005 V−1 and
  = 9 ± 10 s−1 and
  = −0.017 ± 0.012 V−1. (B) Topology for the kinetic scheme for TOM core complex gating. The SX-notation of the kinetic states refers to the conductance class whereas the S ↔ S′ notation indicates the different polarity of the voltage dependence.

