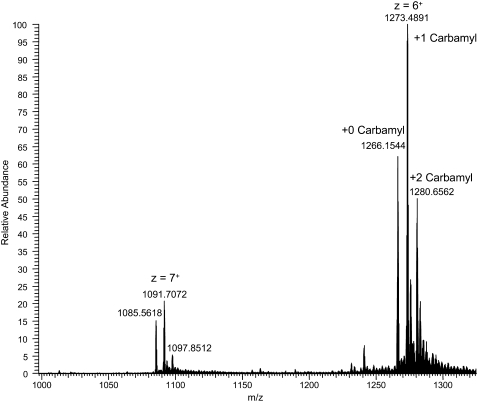
FIGURE 8.
Signal averaged precursor spectrum (t = 42.2–45.3 min) for the various carbamyl adducts. These data were acquired in high resolution mode with the Orbitrap MS and show both the more dominant +6 charge state and the weaker +7 charge state. The mass range of the instrument was not set to identify lower charge state ions (z < 6) at higher m/z values.

