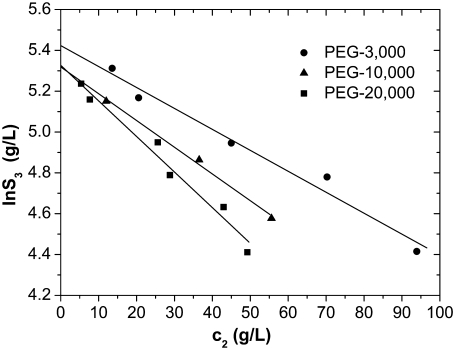
FIGURE 2.
Solubility curves of lysozyme at pH = 4.0 in 0.20 M NaCl, obtained by titration with c2 = 0.60 g/mL PEG-3000 (circles), c2 = 0.45 g/mL PEG-10,000 (triangles), and c2 = 0.30 g/mL PEG-20,000 (squares). Lines represent the results of least squares fit of experimental data by Eq. 5.

