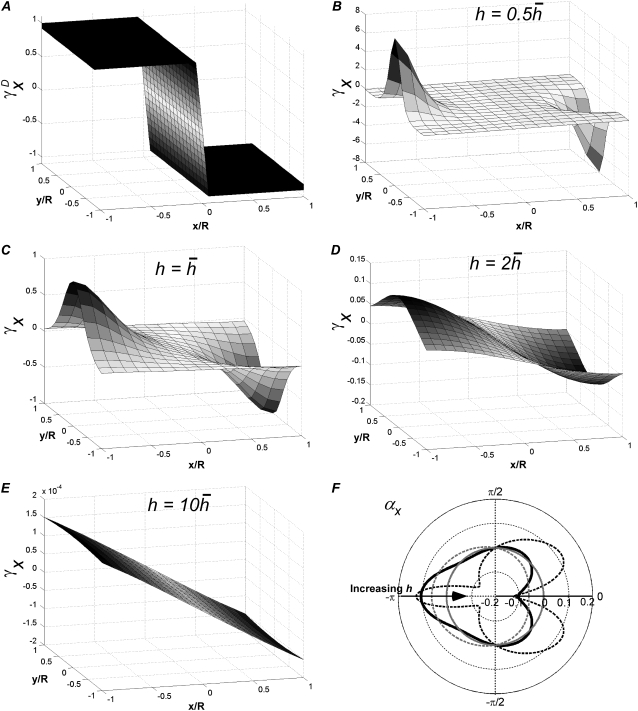
FIGURE 2.
Weighting functions for bipolar pECGs. The value γx, computed by (A) difference method  and (B–E) theoretical method. For panels B–E,
  and
and  respectively. (F) The value αx, computed by theoretical method is shown on a polar plot, with radial axis ranging from −0.2 to 0.2. For panel F,
  (dashed black trace),
  (solid black trace),
  (dashed shaded trace), and
  (shaded trace).

