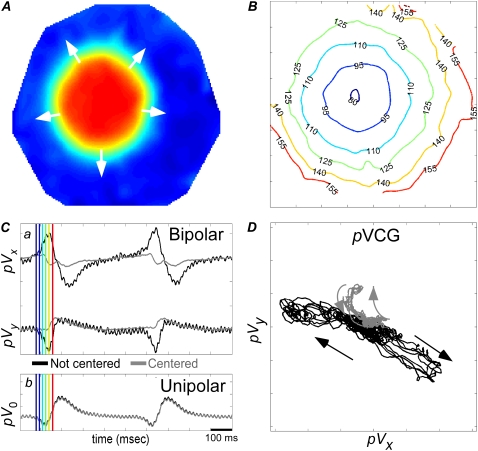
FIGURE 4.
(A) Normalized voltage map for radial propagation. (B) Isochrone map. (C) (a) Bipolar pECGs (pVx and pVy) for leads placed asymmetrically around (solid traces) or centered on (shaded traces) the stimulus site, and (b) unipolar pECG (pV0) for lead offset from (solid trace) or centered on (shaded trace) the stimulus site. The shaded trace is covered by the solid trace at nearly all points and is difficult to see. (D) pVCG for bipolar leads placed asymmetrically (solid trace) or symmetrically (shaded trace) around the stimulus site. Different colors for the isochrones in panel B correspond to the instants of time shown in panel C.

