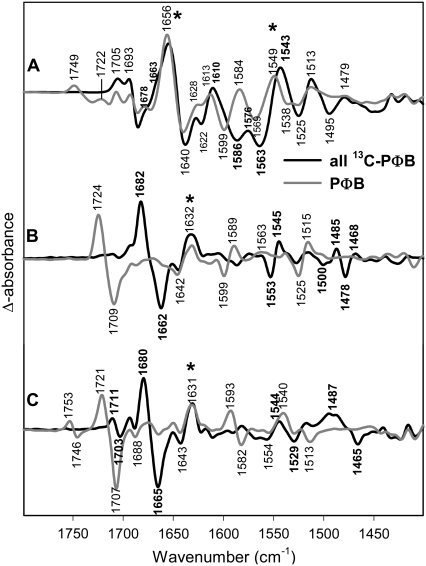
FIGURE 2.
Comparison of FTIR difference spectra of phyA reconstituted with nonlabeled PΦB and phyA reconstituted with uniformly 13C-labeled PΦB. The spectra of the adducts with nonlabeled and labeled PΦB are given by the gray and black lines, respectively. The spectra (from top to bottom) refer to the “Pfr” minus “Pr” (A), “lumi-R” minus “Pr” (B), and “lumi-F” minus “Pfr” (C) differences. Protein changes are denoted by an asterisk. Further details are given in the text (Materials and Methods).

