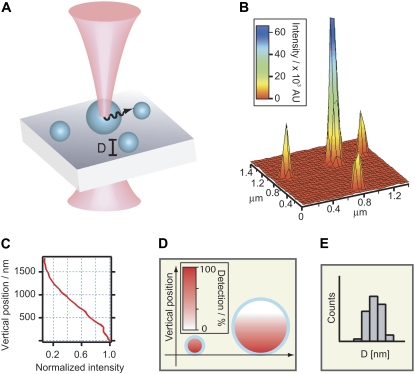
FIGURE 1.
Sketch of intensity-based size mapping. (A) Fluorescently labeled objects with a well defined geometry are imaged with a confocal laser scanning microscope exhibiting an axial decaying illumination/collection profile. (B) Micrograph (intensity surface plot) of lipid vesicles labeled in the bilayer and immobilized on a glass slide through receptor-ligand binding of streptavidin-biotin. (C) The axial part of the microscope point spread function (PSF) determines to what degree an object is illuminated and emitted light is collected. The axial intensity profile of the focused beam along the optical axis (i.e., axial dependence of the PSF) displayed here was measured from an x,y,z image stack of a reflecting surface. (D) Objects comparable in size to the depth of field will exhibit less intensity per volume compared to particles within the field, as indicated by the color table. (E) Knowledge of the PSF, along with the total integrated particle intensities, obtained from micrographs, allow the construction of the physical size distribution of e.g., polydisperse vesicles consisting of vesicles both below and above the optical resolution.

