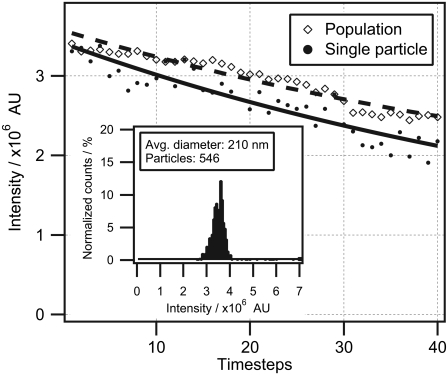
FIGURE 2.
Evaluation of the signal/noise ratio of a single colloidal particle. The solid line represents the bleaching curve of a single 210-nm particle imaged 40 consecutive times and fitted to an exponential decay. Fluctuations in the integrated intensity are calculated as the standard deviation (δI) of each point from the fit. This yielded a deviation value of δI = 5.1%. The dashed line indicates the mean integrated intensity of the full population imaged 40 consecutive times and fitted to an exponential decay. This yielded a deviation value of δI = 2.8%. (Inset) Intensity histogram of the full population constructed from the first micrograph in the time series.

