FIGURE 3.
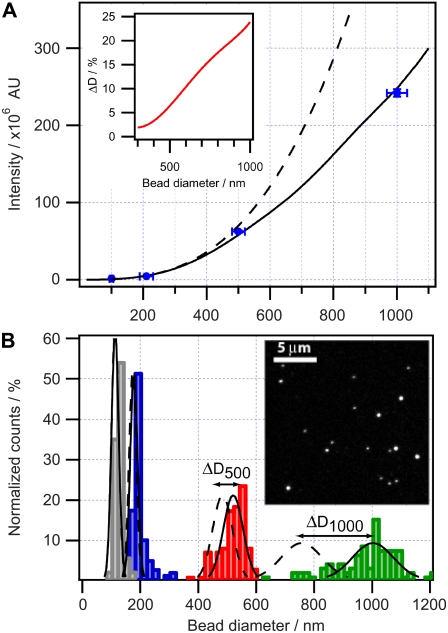
Influence of a confocal depth of field on the measured intensity of fluorescent objects of various sizes. (A) Measured mean intensity of dye-labeled bead populations with specified diameters (blue dots). Acquired intensity calculated using the measured pinhole profile of the microscope (solid line) compared with calculated total intensity of a fluorescent solid sphere (dashed line). Error bars in the x direction correspond to manufacturer specifications, whereas error bars in the y direction (typically <3% of the mean) are deviations from the mean measured intensity. (Inset) The fractional error as a function of bead diameter. (B) Histograms of four fluorescent colloidal bead populations with nominal diameters of 100 nm (gray), 210 nm (blue), 500 nm (red), and 1000 nm (green), with Gaussian fits to confocal-corrected populations (solid lines) and to noncorrected populations (dashed lines). The double arrows indicate the error ΔD in the mean diameter between corrected and noncorrected populations. (Inset) A representative micrograph of the beads.

