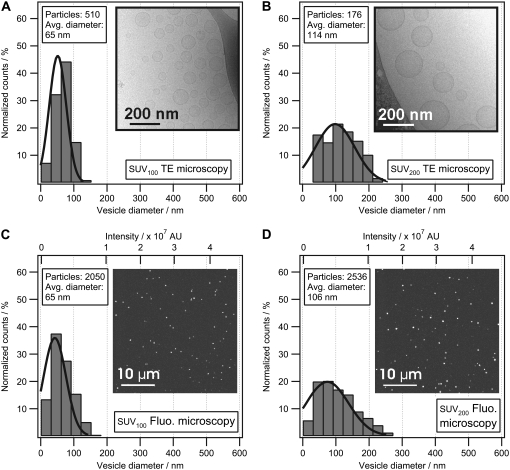
FIGURE 4.
Comparison of vesicle size distributions measured with cryoTEM and CLSM. Size-distribution histograms of extruded vesicles (SUV100 extruded using a filter diameter of 100 nm and SUV200 extruded using a filter diameter of 200 nm) were measured with cryoTEM and CLSM. Vesicles from SUV100 (A) and SUV200 (B) were trapped in an amorphous ice film and recorded with cryoTEM to construct histograms of vesicle sizes. Integrated fluorescence-intensity histograms of SUV100 (C) and SUV200 (D) immobilized on a glass surface and recorded with CLSM. To convert the integrated intensity histogram (C) to a physical size histogram, the mean diameter from the distribution in A was used to convert the abscissa of C to nanometers. Using SUV100 as the reference sample, the physical size distribution of SUV200 (D) could now be determined from the integrated intensity distribution. Comparing B and D, our model reproduces the mean peak of the physical size distribution obtained from cryoTEM within 7%. The shapes of the histograms obtained from cryoTEM and CLSM were found to be identical, thereby confirming that cryoTEM and CLSM reconstruct the vesicle populations in a similar way. Insets show representative micrographs. The brightness and contrast of the images has been optimized for visual purposes.

