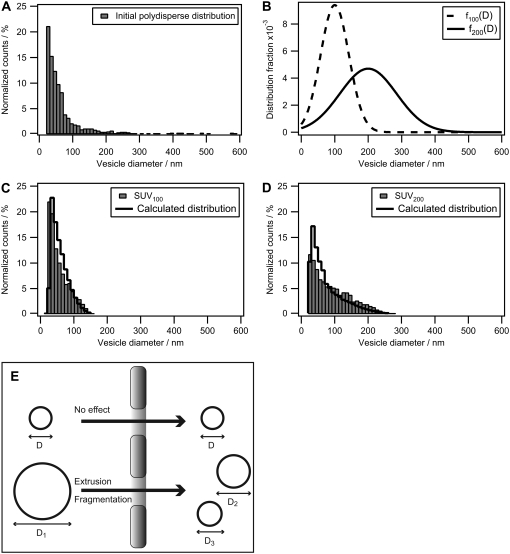
FIGURE 6.
Calculation of the influence of extrusion on the size distribution of polydisperse vesicle samples. (A) Plot of the polydisperse nonextruded vesicle population from Fig. 5 C using a linear y axis. It is evident that small unilamellar vesicles dominate the population and only a few large (D > 200 nm) vesicles are observed. (B) Vesicle redistribution profiles calculated for an extrusion filter with pore diameters of 100 nm (dashed line) and 200 nm (solid line). (C and D) Comparison of measured size distributions of small unilamellar vesicles extruded through either 100-nm or 200-nm pores (bars) with calculated distributions (solid line). The calculated histograms are obtained by applying the respective vesicle redistribution profiles twice on the initial polydisperse population. (E) Sketch of the extrusion process. Vesicles with a diameter, D, less than that of the pore pass unaffected, whereas a vesicle with a diameter greater than the pore diameter undergoes fragmentation.

