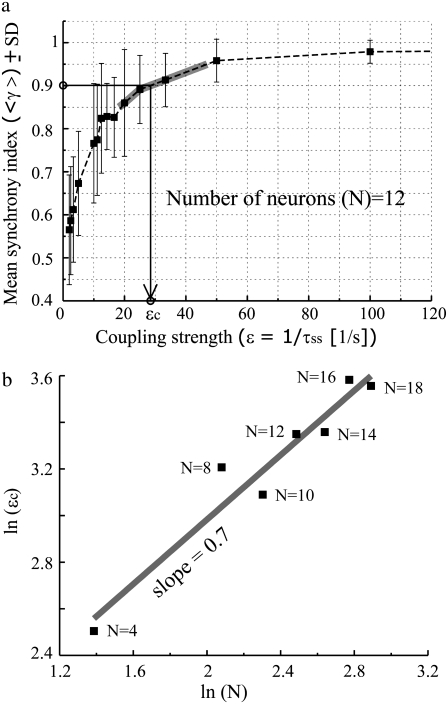
FIGURE 5.
Relation between synchrony index and coupling strength and scaling behavior between the number of neurons in the network and critical coupling strength. (a) The ensemble average synchrony index 〈γ〉 as a function of coupling strength (ɛ) for N = 12 is shown. The critical coupling strength ɛc is determined at the value where 〈γ〉 = 0.9. Solid gray line along the curve indicates interpolated values. (b) The algebraic scaling between ln ɛc and ln N; ln ɛc = α × ln N is plotted. The scaling exponent “a” was 0.7 ± 0.08.

