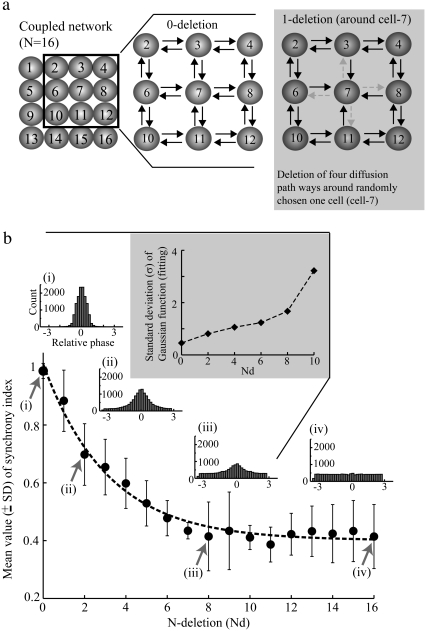
FIGURE 6.
Diffusive coupling and periodicity in extracellular activity. (a) Schematic diagram illustrating how each diffusion path was deleted. (b) The mean synchrony index is plotted as a function of the number of active connections through potassium diffusion. The horizontal axis indicates the number of cells around which four diffusion directions toward their nearest neighbor are blocked. With an intact diffusive coupling ((i) 0-deletion), the local maximum around preferred phases are clearly shown in the distribution, whereas with completely blocked diffusion paths ((iv) 16-deletion), only a flatness is shown, i.e., no phase synchronization takes place. In between situation ((ii) 2-deletion and (iii) 8-deletion), a gradual decrease of the maximum peak of the distribution is illustrated as the number of diffusion path deletions increases.

