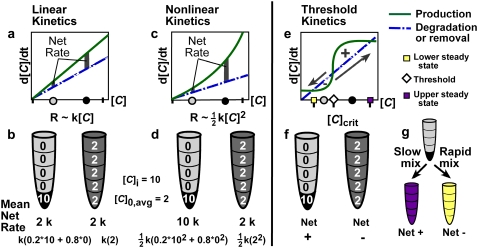
FIGURE 1.
Mixing can affect the rate or outcome of certain nonlinear reactions by removing spatial heterogeneities in the concentration of an activator (1,10). (a, c, and e) Hypothetical rate plots show autocatalytic production (solid lines) and degradation (dashed lines) of an activating species, C. Gray and black dots on the [C] axis indicate hypothetical low and high initial concentrations of C, respectively, and correspond to the gray and black regions shown in the test tubes below. (b, d, and f) An initially unmixed solution has a concentration of C, [C], equal to 10 in the lower subvolume of the test tube and no C in the remaining four subvolumes, so [C]i = 10 and the average initial concentration is [C]0,avg = 2. In a well mixed system, C is evenly distributed throughout the solution. The mean rate of reaction and the calculation thereof is given below each tube in b and d. (a and b) In a linear system, the rate of reaction, R, is linearly proportional to [C]. The reaction rate does not depend on the spatial distribution of activator. (c and d) In a nonlinear system, R is proportional to [C]2 or, more generally, [C]n, where n ≥ 2. Since the rate in each subvolume is no longer additive, the average rate of reaction depends strongly on the distribution of activator and thus on the rate of mixing. (e–g) In a system with threshold kinetics, the spatial distribution of activator, and thus the rate of mixing, controls the direction and outcome of the reaction in addition to its rate. (e) The threshold occurs at the concentration ([C]crit) at which the two rate curves cross and the production curve has the greater slope (diamond). Purple and yellow squares mark the upper and lower stable steady-state concentrations, respectively. (f) Supposing that [C]crit = 5, then the small black region in the left tube has an above-threshold concentration of 10. Though the remaining solution has a below-threshold concentration of 0, this test tube will react to create more C (Net +). The well mixed tube at the right has a below-threshold concentration of 2 throughout, so C will be degraded (Net −). (g) In an initially unmixed solution with a small pocket having [C] > [C]crit, slow mixing permits net production of C until the upper steady state (purple) is reached, whereas rapid mixing lowers the average C to less than the threshold and net degradation brings the system to the lower steady state (yellow).

