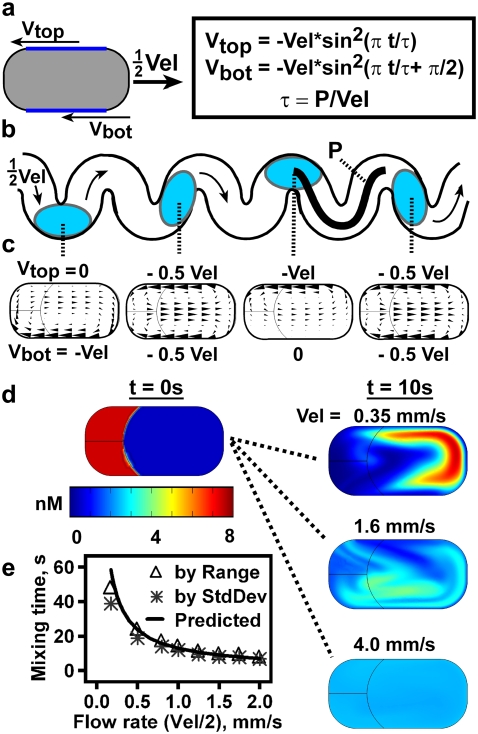
FIGURE 4.
A two-dimensional numerical simulation of chaotic mixing and molecular diffusion in a plug. (a) Fluid flow inside a rightward-moving plug was simulated by moving the top and bottom edges (dark blue lines) of the plug-shaped region leftward with a defined velocity profile. To simulate chaotic mixing as in a winding channel, the velocity profile along the bottom edge, Vbot, is a sine-squared wave, phase-shifted from the profile along the top edge, Vtop (boxed equations) (66). (b) Drawing shows plugs in a winding channel with period τ and distance per period P. This geometry was not drawn into the simulation. (c) Arrow plots produced by the simulation show the flow profile in plugs at time points t = 0, τ/4, τ/2, and 3τ/4, corresponding to the plugs illustrated in b. (d) Chaotic mixing was completed more quickly in plugs flowing at a higher velocity. The left column shows the initial condition (t = 0 s), with 8 nM [C]i (red) at the back of the plug. The concentration scale for all four images is located beneath. The right column shows plugs after 10 s of flow at Vel = 0.35, 1.6, or 4.0 mm/s. Note that the region of highest concentration moves around inside the plug due to chaotic fluid flow and fluid recirculation during mixing. In this experiment, the diffusion constant for C was D = 5 × 10⁻¹¹ m2/s, P = 3.5 mm, and the clotting reaction was turned off. (e) Measured mixing time decreased with plug velocity (0.5 × Vel) in the simulation. The solid line shows the curve predicted by the chaotic mixing scaling law (61) and was calculated relative to the observed mixing time of 7 s at a flow rate (Vel/2) of 2 mm/s.

