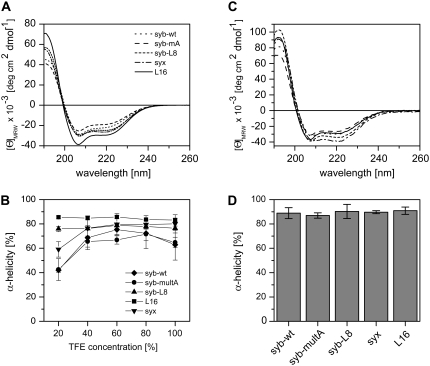
FIGURE 2.
Secondary structure of TMD-peptides determined by CD spectroscopy. (A) Spectra recorded in 60% (v/v) TFE, 20 mM NH4Ac, pH 7.4 at 50 μM peptide. (B) Dependence of α-helicity on TFE concentration. Note the partial unfolding of syx, syb-wt, and syb-multA at 20% TFE. (C) Spectra of peptides reconstituted into liposomal membranes made of DMPC at a P/L-ratio of 0.01. (D) α-Helix contents of membrane-embedded peptides. All spectra were corrected for the background signals seen with pure TFE/buffer (A and B) or pure liposomes (C and D). All values represent means of three independent measurements ± SD. Secondary structure contents were stable for several days.

