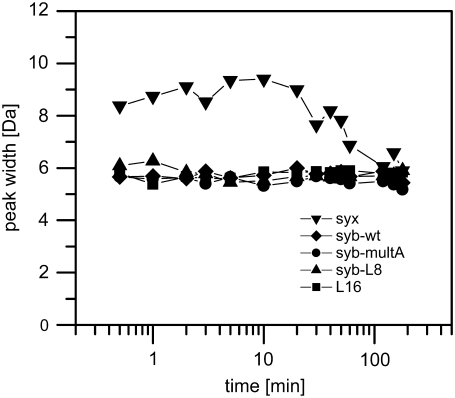
FIGURE 4.
Peak-width analysis. Peak widths at 50% of maximal peak height were determined from the deconvoluted mass spectra obtained in 60% (v/v) TFE, 10 mM NH4Ac, pH 7.4 at 20°C and plotted as a function of reaction time from t = 0.5 min to t = 3 h. Representative spectra were used in all cases except for syx, where lower signal/noise ratios resulted in a greater apparent variability of peak widths; syx peak widths were thus averaged from three independent spectra.

