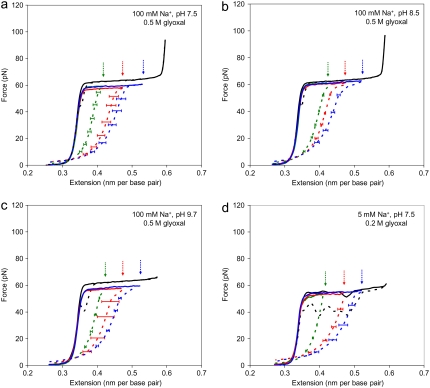
FIGURE 3.
Mapping DNA FIM in the presence of glyoxal. Stretching (solid line) and relaxation (dashed line) curves are shown in the absence (black) and presence (color) of glyoxal. Shown in color are the stretch and relaxation curves after DNA has been overstretched for some time (30 min for 100 mM Na+, and 10 min for 5 mM Na+) in the presence of glyoxal at the corresponding extensions (indicated by arrows). For each relaxed curve, we averaged the relaxation curves of three or more molecules, and error bars are determined from the standard error. We used only stretches of DNA molecules with the least number of nicks by excluding all stretches from DNA molecules that broke at some point during the overstretching transition. Data are taken at (a) 10 mM HEPES (pH 7.5), 100 mM Na+ (95 mM NaCl and 5 mM NaOH), and 0.5 M glyoxal; (b) 10 mM HEPES (pH 8.5), 100 mM Na+ (95 mM NaCl and 5 mM NaOH), and 0.5 M glyoxal; (c) 10 mM HEPES (pH 9.7), 100 mM Na+ (95 mM NaCl and 5 mM NaOH), and 0.5 M glyoxal; and (d) 10 mM HEPES (pH 7.5), 5 mM Na+ (5 mM NaOH), and 0.2 M glyoxal.

