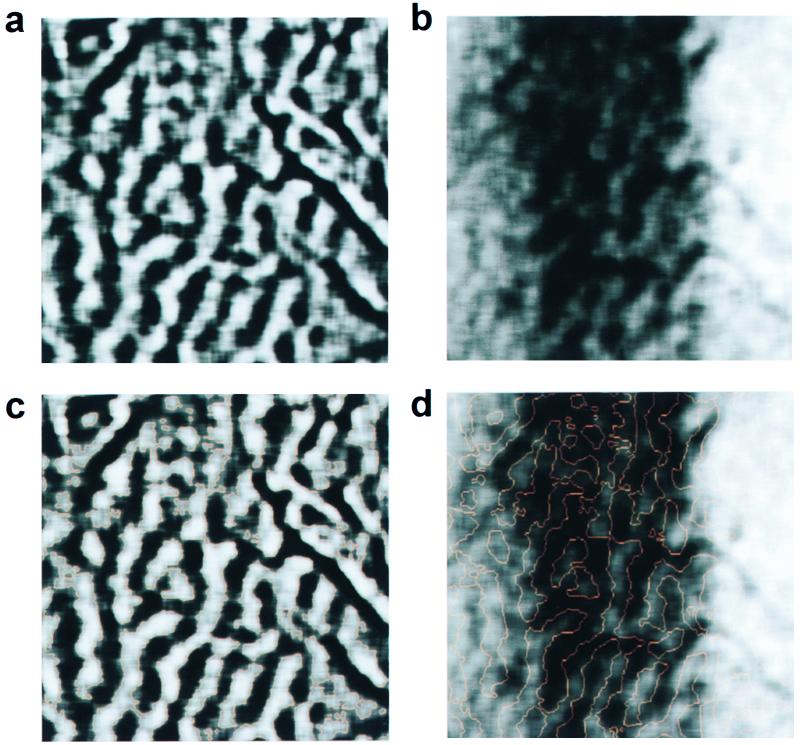
Figure 1.
The functional anatomy of area V-1 with nonillusory stimuli. (a) Ocular dominance bands within a 1 cm2 patch of cortex that was 6° in the visual field periphery and subtended approximately 2° of visual space (as measured with electrode penetrations at each edge of the image). The vertical meridian is oriented along the lower edge of this image. (b) The same patch of cortex now stimulated with a flickering bar having a width of 0.48° and an orientation of 102°, with an image of the cortex unstimulated subtracted. (c) The edges of the ocular dominance bands are highlighted by an edge-finding algorithm (red lines). (d) The ocular dominance edges from c now overlaid on the image from b. Notice that the patchy signal within the stripe of activity matches the ocular dominance pattern.

