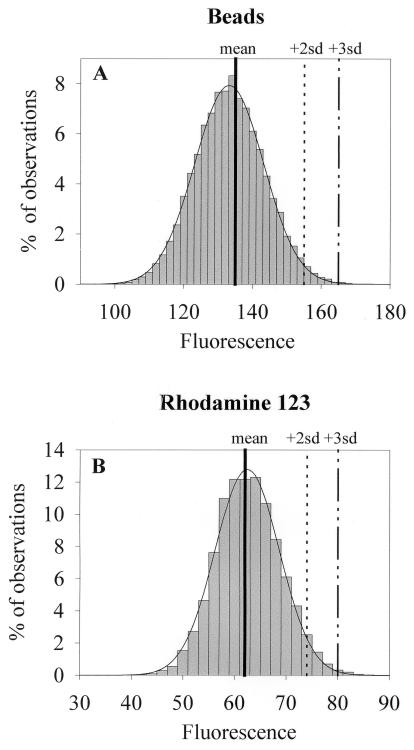
Figure 2.
Distribution of fluorescence in beads and cells loaded with a noncalcium fluorescent probe. (A) A histogram of the fluorescence distribution (bars) in fluorescent beads (two pixels; 19,900 scans) and its fits to a Gaussian distribution (solid line). (B) A histogram of 12,000 scans (bars) from four pixels in a presynaptic bouton stained with rhodamine 123, and it fits to a Gaussian distribution (solid line).

