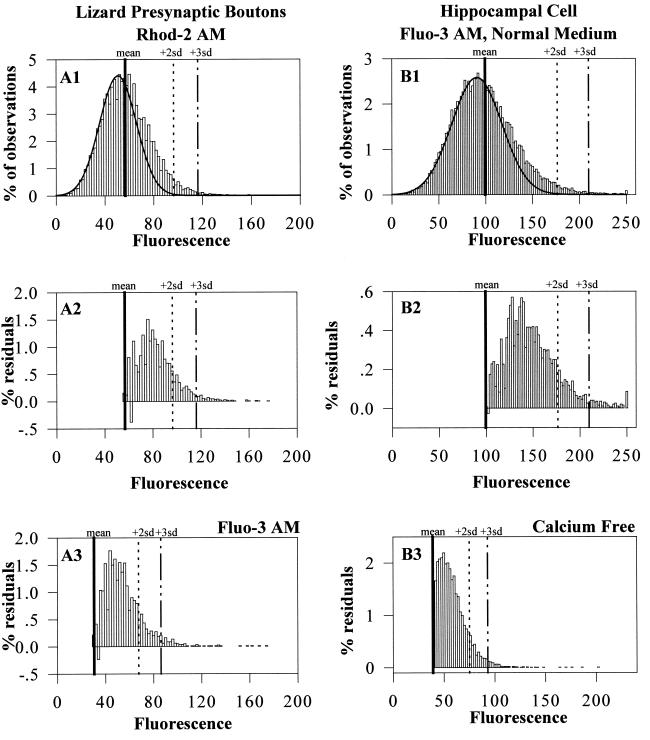
Figure 3.
(Left) Fluorescence distribution and residuals in presynaptic boutons. (A1) A histogram of 18,000 scans from six pixels in a presynaptic bouton stained with Rhod-2 AM superimposed with a Gaussian fit (solid line). (A2) A histogram of the residuals above the mean, calculated by pstat. (A3) A histogram, as in A2, for Fluo-3 AM-stained preparation. (Right) Fluorescence distribution and residuals in hippocampal cells. (B1) A histogram of the fluorescence distribution (bars) in hippocampal cells (two pixels; 19,900 scans) and its Gaussian fit (solid line). (B2) A histogram of the residuals' fluorescence distribution in a hippocampal cell in normal medium. (B3) A histogram, as in B2, for nominal calcium-free medium.

