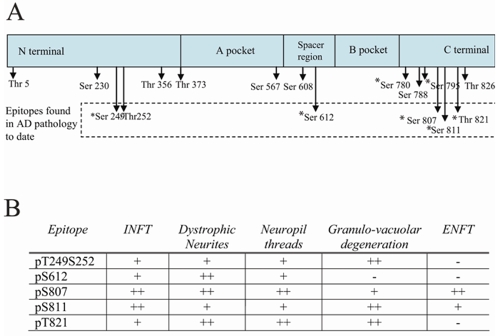
Figure 2.
A. Schematic representation of the pRb protein showing known phosphorylation sites. Those epitopes examined in this study are denoted with an (*). Epitopes found to be present in AD pathology in the present study are denoted in the dashed box. B. An overview of the pathological structures revealed by antisera specific for different phosphorylation sites spanning pRb.

