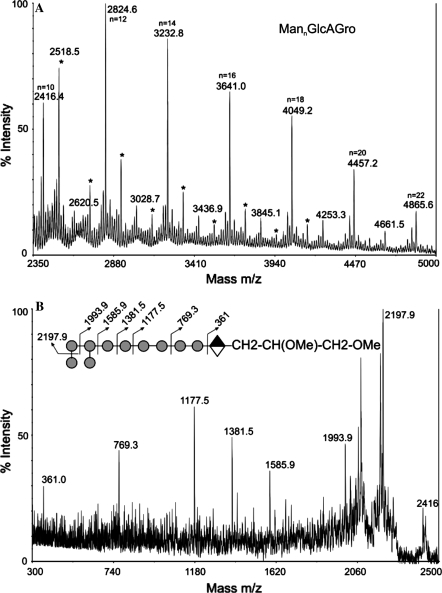
Fig. 3.
MALDI-TOF/TOF analysis of permethylated Cg-LM-B [M + Na+] MannGlcAGro. (a) MS spectrum of the dervatized Cg-LM-B. Unassigned peaks (*) are due to permethylation artifacts. (b) CID-MS/MS analysis of m/z 2416 (M + Na+) Man10GlcAGroAc. A possible structure and CID fragmentation pattern of peak m/z 2416 is depicted in the cartoon representation, inset. Circle-mannose; diamond-glucuronic acid

