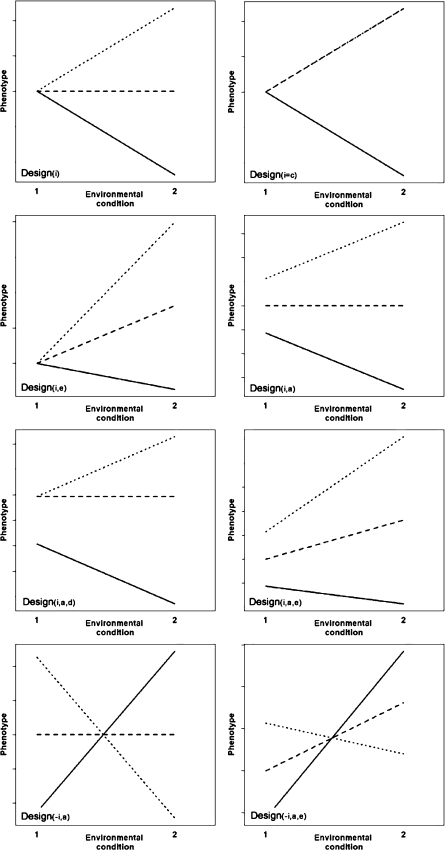
Fig. 1.
Different patterns of genotype-environment interaction. Design (i): interaction effect for homozygotes, no main effects; Design (i = c): interaction effect for homozygotes and heterozygotes, with interaction effect heterozygotes equal to effect A1 homozygotes, no main effects; Design (i,e): interaction effects homozygotes, and main effect environment; Design (i,a): interaction effect homozygotes, and QTL effect; Design (i,a,d): interaction effect homozygotes, and main effect QTL including dominance; Design (i,a,e): interaction effects homozygotes, and main effects environment and QTL; Design (−i,a): reversed interaction effects homozygotes, and main effect QTL; Design (−i,a,e): reversed interaction effects homozygotes, and main effects environment and QTL

