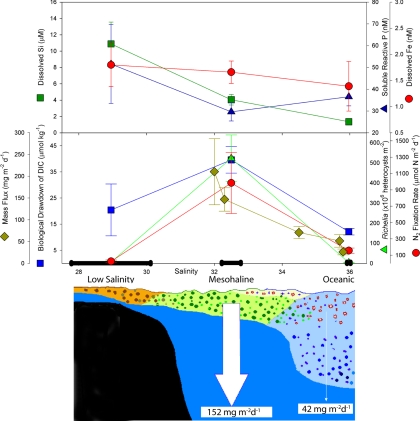
Fig. 3.
Changes along the river plume as it moves offshore. (Top) Changes in surface nutrient concentrations as a function of salinity for each of the station types; the values and statistics are presented in Table 1. Error bars denote standard error; the thick horizontal line on the x axis indicates the mean salinity ±1 S.E. for each group of stations. (Middle) Changes in biological response and mass flux from floating sediment traps at 200 m presented as in A. (Bottom) A schematic of changes along the plume; the arrows showing the mean mass flux for the mesohaline, and oceanic stations. The brown particles represent coastal phytoplankton species; the dark green represents DDA; the red represents Trichodesmium; and the blue represents particles typical of oligotrophic oceanic phytoplankton. Phytoplankton chlorophyll, Trichodesmium, and Richelia concentrations are given in Table 1. Water below the euphotic zone is depicted in solid dark blue, and the 1% light depths are given in Table 1.

