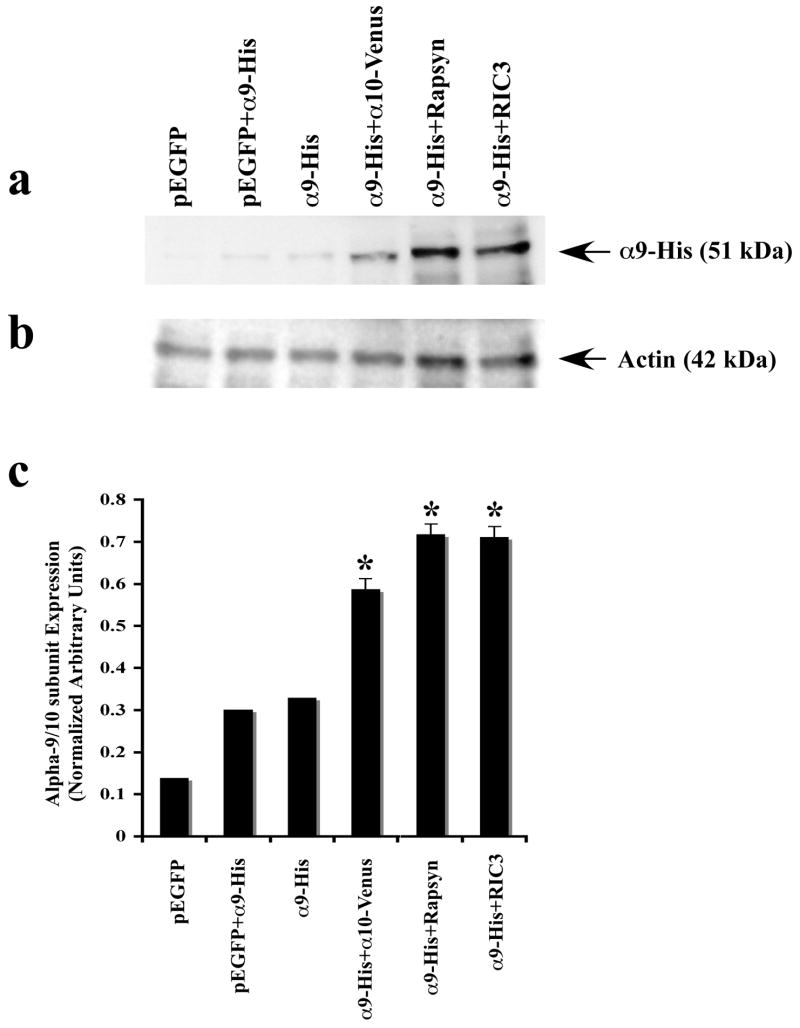
Figure 6.
Expression of nAChR α9 subunit in cultured CL4 cells transfected with various cDNA constructs as described in Methods. (a) Immunoblots of α9 in the presence of α10, rapsyn and RIC-3. No α9 expression was observed when CL4 were transfected with pEGFP alone. Both co-transfection of α9 with pEGFP and nAChR α9 transfection alone showed low levels of α9 protein. Co-transfection of α9 with α10 increased α9 protein expression. Co-transfection of nAChR α9 with either rapsyn or RIC-3 showed the highest levels of nAChR α9 protein expression. (b) Blots were stripped and reprobed with anti-actin antibody to confirm equal protein loading and comparable expression levels. (c) Quantification of nAChRα9 protein bands is plotted as normalized relative arbitrary density units. Data are means of three independent experiments (n = 3), each performed in duplicate. Significant differences, determined by two-tailed student t-test, are indicated (*, p < 0.05). A statistically significant difference was observed between α9 protein expression levels in CL4 cells.

