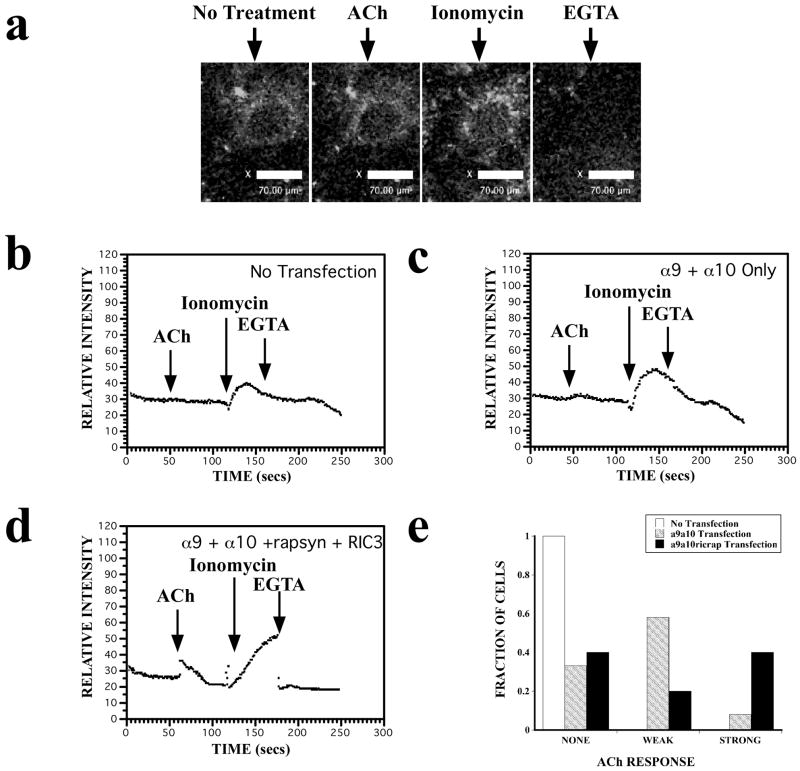
Figure 7.
The expression of rapsyn and RIC-3 increases intracellular calcium levels in nAChR α9α10 transfected CL4 cells as indicated by changes in Fluo-4 fluorescence. In all experiments, ionomycin showed maximum calcium responses and EGTA showed minimum calcium responses as indicated by arrows. All functional responses wer measured as agonist-induced elevations in intracellular calcium, and presented as relative mean intensity for each experiment. Three to five independent experiments were performed in duplicate. (a) Representative images of fluorescence changes in a CL4 cell transfected with nAChR α9α10 cDNAs, loaded with Fluo-4-AM dye (10 μM) and bathed in Ca2+ -containing medium HBSS (Hanks Balanced Salt Solution). Shown are fluorescence images before and after ACh treatment, after ionomycin treatment, and after EGTA treatment. (b) Representative fluorescence changes versus time from non-transfected CL4 cells show no response to 100 μM ACh but do show maximal and minimal responses to ionomycin and EGTA, respectively. (c) Representative fluorescence changes versus time from CL4 cells transfected with nAChR α9 α10 subunit cDNAs. There is a small increase in fluorescence upon application of 100 μM ACh. (d) Representative fluorescence changes versus time from CL4 cells transfected with nAChR α9, α10, rapsyn, and RIC-3 cDNAs. A larger fluorescence response is shown upon application of 100 μM ACh. (e) The fraction of cells that responded to ACh treatment with no response, a small response (< 10 relative fluorescence units), or a large response (> 10 RFU). Data was collected from 40 cells that had no transfection, 38 cells that had α9α10-YFP transfection, and 28 cells that had α9α10-YFP, rapsyn and RIC-3 transfection.

