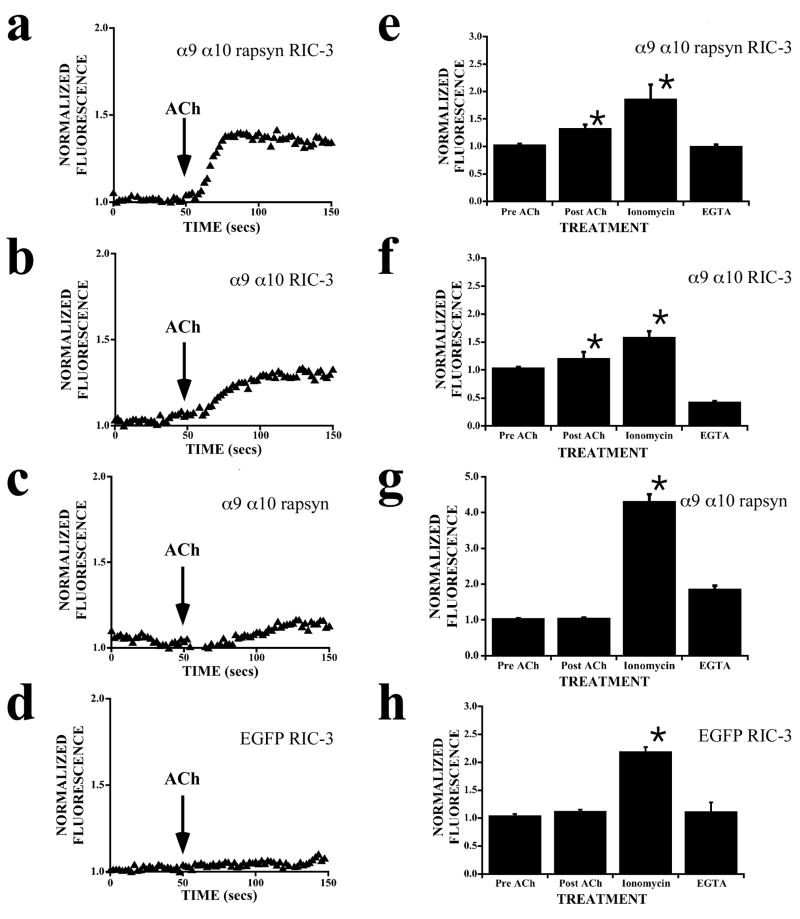
Figure 8.
Effect of RIC-3 and rapsyn expression on ACh-evoked cytosolic calcium levels in α9α10 transfected CL4 cells. Following transfection, CL4 cells were loaded with X-rhod-1, and fluorescence was monitored. (a–d) Representative normalized (F/F0) fluorescence changes versus time are shown before and after addition of 100 μM ACh. (e–f) Bar graphs show averaged fluorescence responses (mean ± S.E.) from a minimum of 20 transfected CL4 cells in response to 100 μM ACh, 5 μM ionomycin, and 30 mM EGTA. (a) Normalized (F/F0) fluorescence fromα9-α10-rapsyn-Ric3 transfected CL4 cells increases by roughly 40% in response to 100 μM ACh. (b) Normalized (F/F0) fluorescence fromα9-α10-Ric3 transfected CL4 cells increases by roughly 25% in response to 100 μM ACh. (c) Normalized (F/F0) fluorescence from α9-α10-rapsyn transfected CL4 cells does not change significantly from base line in response to 100 μM ACh. (d) Normalized (F/F0) fluorescence from EGFP-Ric3 control transfected CL4 cells shows no response to 100 μM ACh. (e) The bar graph shows averaged fluorescence responses from α9-α10-rapsyn-Ric3 transfected CL4 cells (n=20 transfected; mean ± S.E.; p < 0.01). (f) The bar graph shows averaged fluorescence responses from α9-α10-Ric3 transfected CL4 cells (n=20 transfected; mean ± S.E.; p < 0.01). (g) The bar graph shows averaged fluorescence responses from α9-α10-rapsyn transfected CL4 cells (n=20 transfected; mean ± S.E.; p < 0.01). (h) The bar graph shows averaged fluorescence responses from EGFP-Ric3 control transfected CL4 cells (n=20 transfected; mean ± S.E.; p < 0.01).

