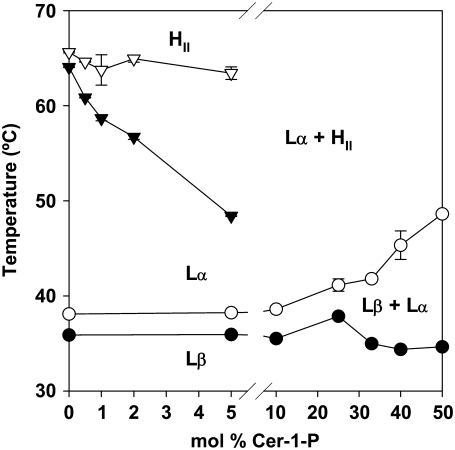
FIGURE 8.
Temperature-composition diagram (phase diagram) for the DEPE/Cer-1-P system in aqueous medium (excess water). Lβ, gel phase; Lα, liquid-crystalline or fluid phase; HII, inverted hexagonal phase. Average values ± SD (n = 3). In some cases the standard deviation is approximately the size of the symbols.

