FIGURE 9.
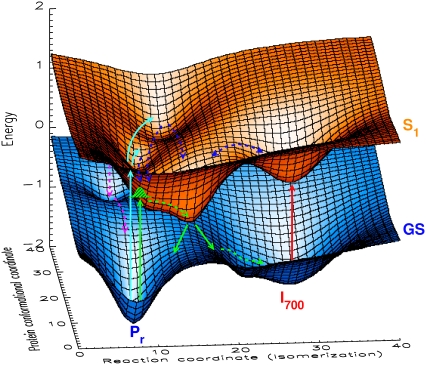
Cartoon showing a three-dimensional presentation of the excited (S1) and ground state (GS) potential energy surfaces for the Pr to Pfr phototransformation of native phyA. The S1 potential surface of Pr has several potential minima which are separated by low barriers and can be reached after photoexcitation. The model separates the reaction coordinate for chromophore isomerization from the perpendicular reaction coordinate(s) of the protein/chromophore conformations not leading to isomerization. The green arrows indicate the excitation into a state with low excess energy and direct relaxation into the active channel leading to I700. The green shaded Gaussian (reached by the green upward arrow from Pr) indicates the initially created wavepacket in the excited state. The light blue arrows shows excitation into states with higher excess energy. The dark blue arrows show movements on the excited-state potential surface—involving chromophore and protein modes—leading out of nonreactive or less reactive channels (potential minima). The red arrow indicates excitation of I700 into an excited-state surface common to I700 and Pr. The purple arrows indicate internal conversion from nonreactive potential minima back to the Pr ground state (for further discussion see text). Note that the detailed form of these potential energy surfaces should not be taken literally. The figure merely serves to illustrate the principal properties of the dynamics in the excited state and the interpretation of parallel and/or alternative processes.

