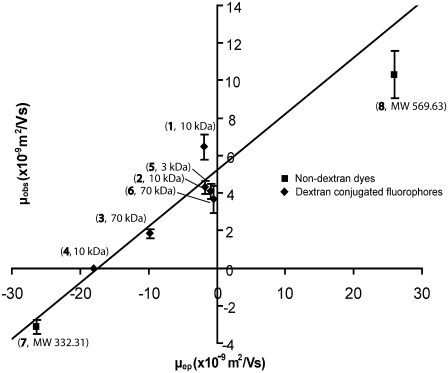
FIGURE 4.
The effective mobility in tissue as a function of the electrophoretic mobility. The line is the best fit to all of the data (linear regression). The labels at each point identify the identity of the fluorophore (see Table 1) and its molecular mass.

