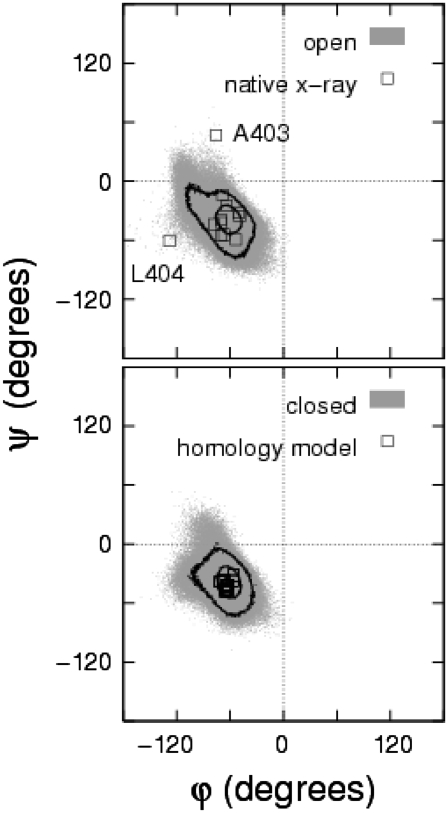
FIGURE 2.
Ramachandran plots for residues A397–V408 of Shaker for the native open (top) and homology-based, pore domain closed (bottom) model states undergoing ∼10 ns of fluctuations at equilibrium under a single soft restraint (τ = τmin = 150 ps) (gray shading). Data for the end-point reference models are indicated (squares). Contours denote probability levels of 5 × 10⁻³ and 5 × 10⁻⁴; lower levels were not distinct. The results for the full (Rosetta) model set were not significantly different.

