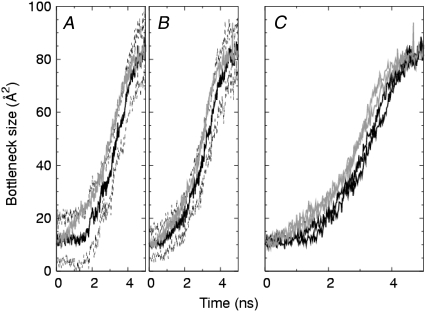
FIGURE 9.
Modified time series of bottleneck sizes, averaged across all cycles for each time point, for (A) the pore domain model, (B) the full model, and (C) both models superposed. The extent of opening accounts for points in time associated with the closing transition that have been folded back onto the time points associated with the opening transition. Opening transitions (dark lines), with error estimate (±σ, dashed lines), and closing transitions (gray lines) are shown.

