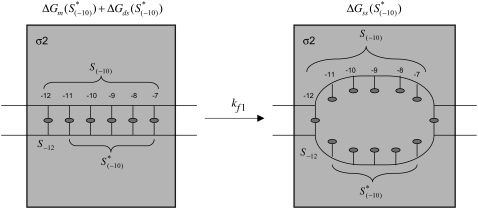
FIGURE 2.
Illustration of the first step in the open complex formation. The left-hand side of the figure illustrates interaction of σ with the −10 region in the closed complex. The right-hand side of the figure indicates the melted −10 box, which corresponds to the intermediate open complex. Six bases that correspond to the −10 box are indicated by their positions (−12 to −7) relative to the transcription start site. The transition, with the rate kf1, from closed to intermediate open complex is indicated by the arrow. The shaded square indicates σ2 domain, which interacts with the −10 region. The energies that correspond to the closed and open states, as well as the sequence notation that is used in the text are indicated in the figure.

