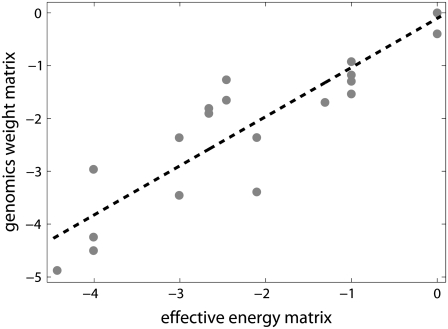
FIGURE 4.
Comparison of the model with genomics data. The values on the vertical axis are elements of the genomics weight matrix, which correspond to −10 region. The genomics weight matrix was constructed based on experimentally determined transcription start sites assembled in RegulonDB database (17). The values on the horizontal axis are the corresponding elements of the effective energy matrix, in units of kBT. The melting energy part of the effective energy matrix was calculated based on the parameters summarized in Blake et al. (24), at physiological conditions (37°C and 0.15 M, respectively) under which most of the experimentally determined transcription start sites are likely sampled. The source of data and the experimental conditions used to infer interaction energies of RNAP with DNA that enter the effective energy matrix are the same as those in the legend of Fig. 3. The zero at each column of the matrices is chosen to coincide with the consensus base at the given position in −10 box. (Note that an arbitrary base independent value can be added to each column of the weight matrix, which corresponds to shifting the position of zero of energy.) The dashed line is the linear fit to the data.

